
For low temperature thermometry, negative temperature coefficient (NTC) temperature sensors like Cernox, and ruthenium oxide (Rox) provide excellent sensitivity and resolution. The resistance-temperature characteristic is relatively fixed for Rox sensors but can vary significantly for Cernox RTDs due to their different fabrication processes. There’s a misconception that higher resistance equates to better resolution and accuracy for these sensors. This note explores whether higher resistance truly results in better performance for NTC temperature sensors. 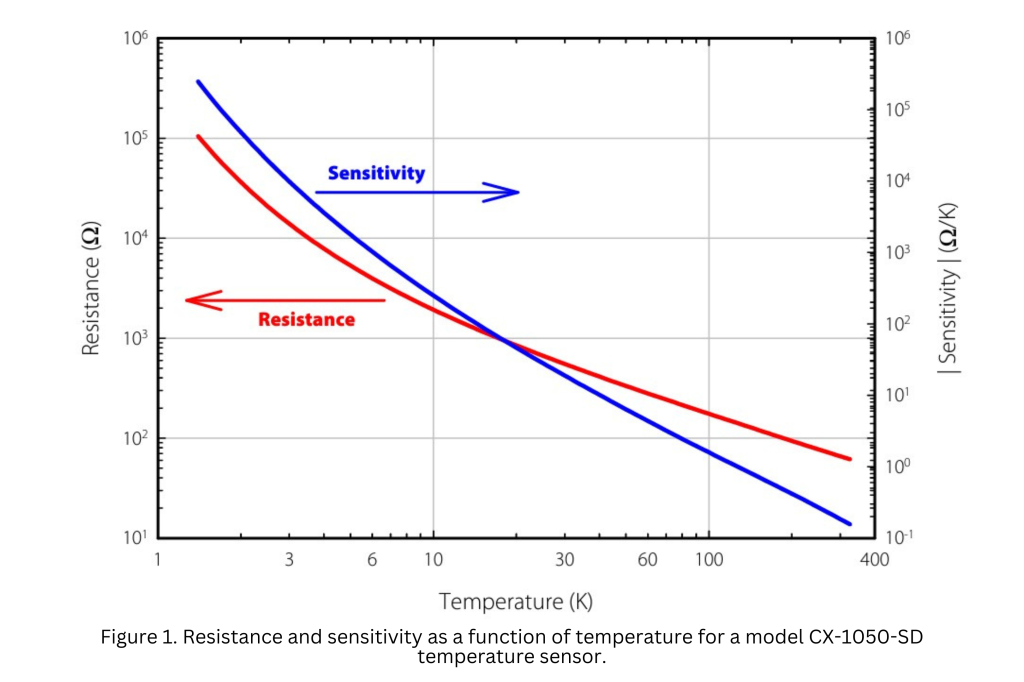
Instrumentation
Understanding resolution and accuracy in temperature measurement requires considering the entire system, including the electronics measuring the sensor’s resistance. The physical sensor’s construction may limit excitation power to prevent self-heating, but it’s the electronic resolution and accuracy that determine overall measurement quality. These factors depend on the resistance range and excitation power level.
Below 20 K, the thermal conductivity of sensor materials decreases, necessitating lower power dissipation to avoid self-heating. NTC sensors are often operated at “constant voltage” over large temperature ranges. For Cernox or Rox RTDs, a 10 mV excitation voltage works well from 1.4 K to RT. However, cryogenic temperature controllers usually function as constant current sources, meaning the actual excitation voltage varies, forming a sawtooth pattern as the resistance range changes.
Example
A model CX-1050 with resistance and sensitivity as a function of temperature shown in Figure 1, measured with a Lake Shore Model 340 temperature controller with a nominal excitation of 10 mV from 1.4 K to 325 K. This controller has resistance ranges with upper limits from 30 Ω to 300 kΩ. Assuming the CX-1050 temperature sensor is measured on the lowest resistance range possible, the excitation current, IExc, is given by VSet/RRange
where VSet=10 mV. The actual excitation voltage is given by VExc
= IExc,Ч RMeas
where RMeas is the measured temperature dependent resistance of the sensor.
Figure 2 shows the actual voltage excitation and power dissipation as a function of temperature for the sample CX-1050-SD. As the resistance range changes the voltage excitation and power dissipation abruptly change resulting in the saw tooth shape curves. The resistance range for each segment of the two curves is labelled. The nominal 10 mV excitation is achieved only at full scale on a given resistance range. 
Just as the power dissipation depends upon the set excitation level and resistance range, so do both the resolution and accuracy (uncertainty) of the measurement as shown in Figure 3. Again, the resistance range for each segment of the two curves is listed. As shown in the CX-1050 example, the best temperature resolution occurs around 3.5 K on the 30 kΩ scale, demonstrating the challenges of measuring high or low resistance. 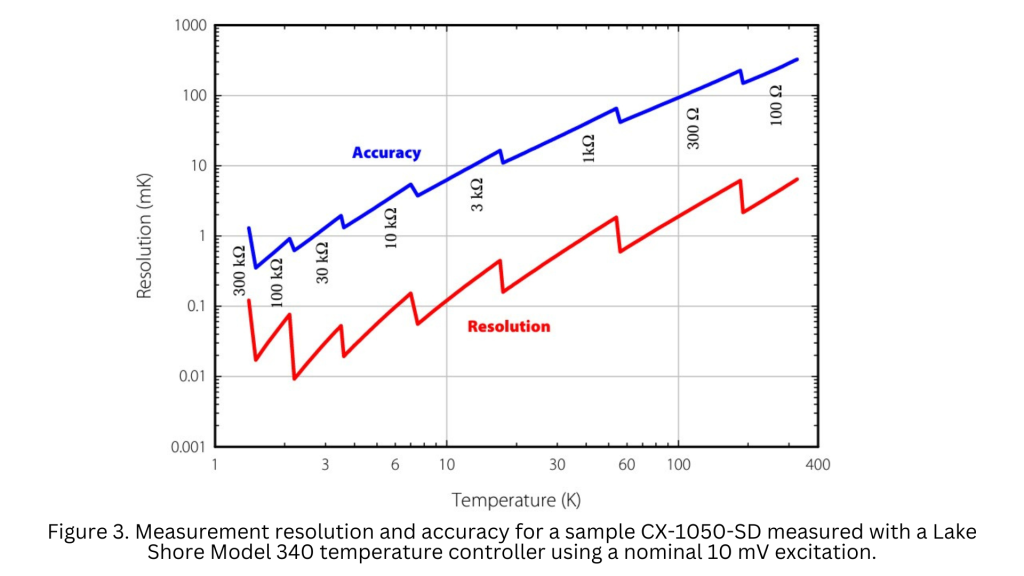
The resolution and accuracy of temperature measurements depend on the set excitation level and resistance range. As shown in the CX-1050 example, the best temperature resolution occurs around 3.5 K on the 30 kΩ scale, demonstrating the challenges of measuring high or low resistance. Changing resistance ranges as temperature changes can cause fluctuations in power dissipation, resolution, and accuracy, potentially leading to unstable control temperatures. Most instruments have overlapping resistance ranges to mitigate this issue, though the only way to know the resistance range is to query the instrument.
Sensor Resistance
Resistances that are too high (> few hundred kilohms) or too low (< 10 ohms) are more difficult to measure than resistances between the two extremes. Instrument specifications can degrade at either extreme. Low (5 kΩ), moderate (50 kΩ), and high (100 kΩ) resistance is somewhat arbitrary and is a trade-off between being high enough to give reasonable resolution, but not too high as to be difficult to measure.
For the CX-1050 sensor measured with a Lake Shore Model 340, the temperature resolution and accuracy were computed for each sample, shown in Tables 1 and 2. The best values are back-shaded in each Table.
Tables 1a and b illustrate that low resistance samples, despite having lower sensitivity, can provide better resolution. High resistance samples don’t always offer the best temperature measurement uncertainty. The differences in resolution and sensitivity are usually within a factor of 2 among the resistance ranges at any given temperature.
Operating at “constant” voltage can skew results, as low resistance sensors dissipate more power, potentially yielding better specifications.
However, normalizing measurement power to a moderate resistance sample shows consistent results with Tables 1a and b.
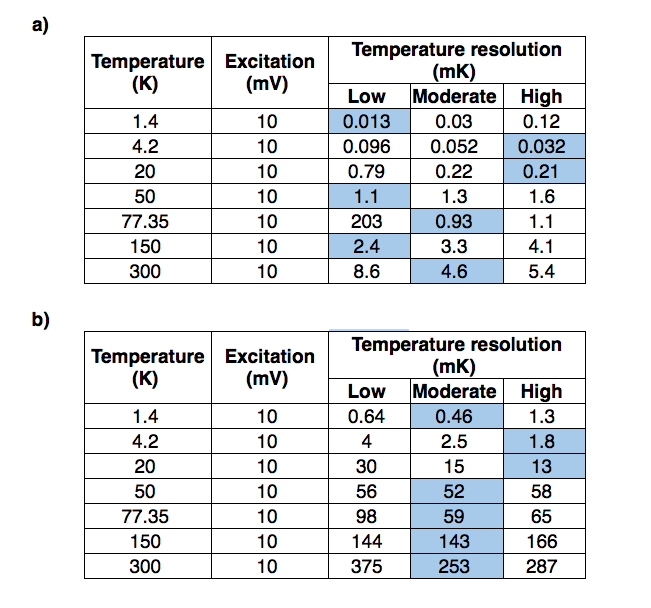
Table 1. a) Temperature measurement resolution for low, moderate, and high resistance CX-1050 RTDs measured with a Lake Shore Model 340. Excitation level is listed.
b) Total temperature uncertainty due to electronic measurement error for low, moderate, and high resistance CX-1050 RTDs measured with a Lake Shore Model 340. Excitation level is listed.
Conclusions
Instrumentation subtleties, such as excitation mode and resistance range switching, significantly impact low temperature thermometry measurements. Higher resistance does not guarantee better resolution and accuracy. The best sensor depends on the resistance range the instrument operates within. Generally, low resistance samples perform as well as high resistance samples, with differences usually less than a factor of two.
The Lake Shore Cryotronics range is sold exclusively in the UK and Ireland through Quantum Design UK and Ireland. For more information, please contact our Technical Sales Engineer, Dr. Alex Murphy by email or call (01372) 378822.
Visit qd-uki.co.uk for more information.
