 Flowmeters are often chosen according to the specifications as listed within the documents supplied by the manufacturer. It is only later, when the instrument is being used under actual operating conditions, that an engineer can assess the validity of those specifications.
At this point it is important to state that the efficacy of a manufacturers specifications at calibration conditions is not being questioned. However, the unknown variables (from a manufacturers point of view) of an actual application can sometimes have an impact on the measured results as seen from the engineers point of view. Differences in accuracy under actual operating conditions can be significant and from that latter point of view can differentiate between a “highly accurate device at calibration conditions” and a “highly accurate device in my particular application”.
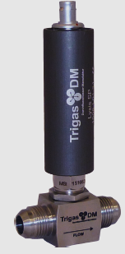 The example below is supplied by a major calibration laboratory. Calibrations are performed with DAkkS certified test benches according to the ISO 17025 norms. Two turbine flowmeters were selected; once being the DM-16 turbine flowmeter from TrigasDM and the other being a competitive product within the same price bracket. For this discussion we can call this turbine flowmeter 2.
Turbine 2 is specified in the manufacturer’s leaflet for hydraulic oil applications. Accuracy should be better than 2% OR (Of Reading) for viscosities between 0… 100 mm²/s. It has a 4… 20 mA output, which is scaled over 0…120 l/min.
The tests below were conducted within the acceptable viscosity range; specifically at 10 mm²/s and 50 mm²/s.
Test Results For Flowmeter 2 :


 At a low viscosity of 10 mm²/s (blue curve) flowmeter 2 stays within the 2% accuracy limit at above 90% of the range. But at the low flowrates deviations increases up to 30%. This may be acceptable if the customer is not running the device in the lower 10% range.
However, performance deteriorates as the viscosity increases to 50 mm²/s (white curve). Below 75% of the range the deviations rise above 2% and up to 34%.
Clearly, the higher the viscosity, the worse the deviation. It is possible that this variation was not envisioned when the engineer originally studied the sales brochure. Should he operate the device at two different viscosities his measured results will vary between 70% (at about 12% of the range) and 2% (at 100% of the range).
 It can be argued that making these comparisons by using the analogue output of the flowmeter is not a valid criterion for judging the performance and quality of the flowmeter as there is an additional A/D conversion involved.
Therefore, another measuring cycle was taken by using the raw frequency of the flowmeter to avoid any scaling errors.
 The results were better, but still we see deviations between the 10 mm²/s curve and the 50 mm²/s curve of minimum 2% up to 12%.
The raw frequency output for the DM-16 also showed similar deviations at low flowrates, but a better performance at higher rates. Still this is not an ideal solution for an oil application.
If the customer knows that he has a media with changing viscosities (because of the use of different media or just because of certain temperature changes), his flowmeter should be able to recognize and respond to these changes.
For turbines in oil applications of varying viscosity, TrigasDM applies a UVC calibration. Multiple calibration curves are generated within the viscosity range that the customer expects during operation. The data is then combined into a Universal Viscosity Curve (UVC) which is used by the electronics to compensate in real time for changing viscosities.
Of course, it can be argued that UVC principles could also have been applied on flowmeter 2 – even though the manufacturer does not offer this option. In order to maintain the fairness of the comparison, TrigasDM also applied the UVC to flowmeter 2.
The results for both devices, with the applied UVC curve, are shown in this diagram:
 As can be seen, flowmeter 2 could be quite fairly compensated in the higher flow ranges however in the lower ranges it was not predictable.
The DM turbine on the other hand shows a perfectly stable curve, independent of the viscosity.
Conclusion:
Engineers who are looking for flowmeters for oil applications should talk to their suppliers in detail about the accuracy at changing viscosities. As seen however, advanced modern turbines, which are specifically designed for applications with changing viscosities, meet many all of the requirements of high technology flowmeters in relation to a long-life, low pressure drop, high accuracy and proven reliability.
![]() Premier Control Technologies Ltd
Premier Control Technologies Ltd
Unit 1 Oaktree Business Park
Philip Ford Way
Wymondham
Norfolk
NR18 9AQ
Tel +44 (0) 1953 609930
E: sales@pctflow.com
W: www.pctflow.com/trigas